COVID-19 School Data Hub
Dr. Emily Oster—author, economics professor at Brown University, and Rhode Island resident—is big on research and data, and has (written) the books to prove it. When she took to Twitter, seeking a partner to help create a blog resource on COVID-19, Township reached out, helping publish data around masking and sanitizing in the early stages of the pandemic. But the pronounced data gap around the educational impacts of COVID prompted a brand new project for the partners: a school data hub.
To better understand the varied consequences of school closures, Dr. Oster and her team began to gather data about educational modes employed in each state due to COVID-19, including:
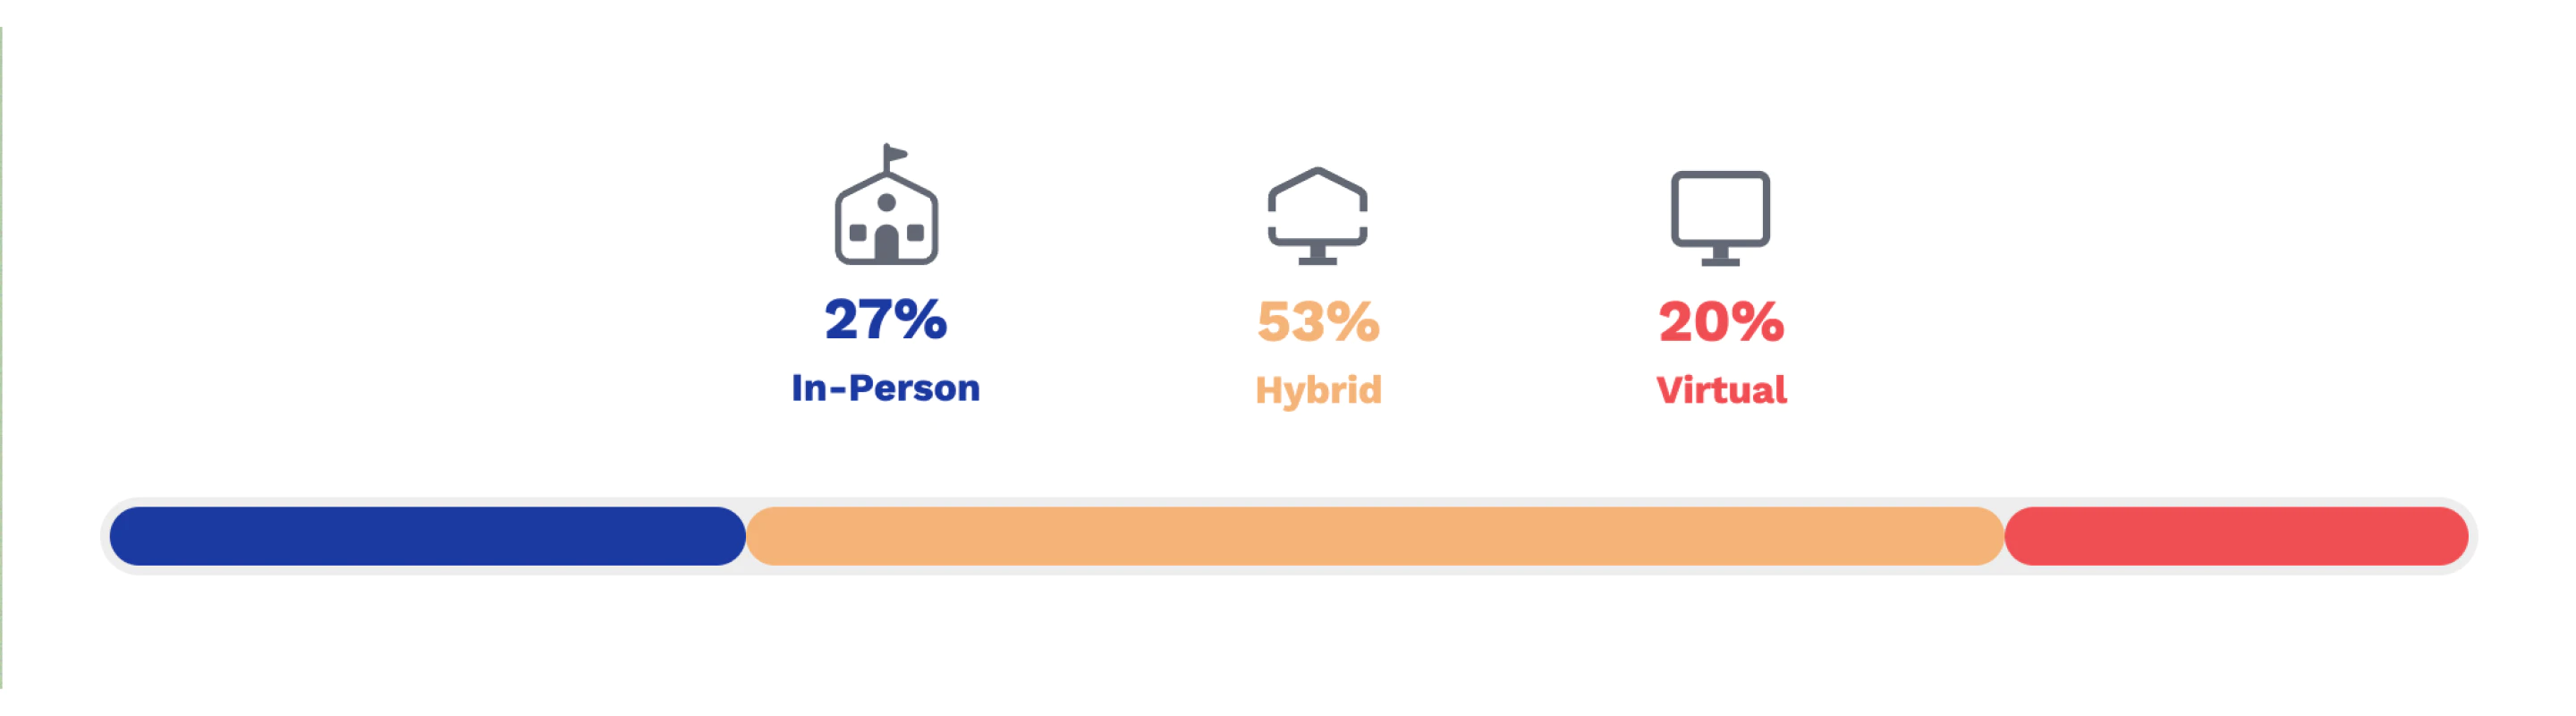
Learning model (e.g., virtual, hybrid, in-person)
Enrollment by learning model
COVID-19 case counts among students and/or staff

The Challenge
The U.S. contains approximately 13,800 public school districts, all of which did virtual, hybrid, and in-person schooling at varying times. Dr. Oster’s team collected and analyzed the mountain of data submitted; but they also sought a meaningful way to share it with the educators, researchers, and policymakers who would determine learning and health decisions for future school years.
Both Township and Dr. Oster’s team saw immeasurable value in providing a free resource to the larger community.
Approach
At the outset of the project, Township collaborated and closely communicated with Dr. Oster’s team to show school learning models from 2020-21. Turning data into something meaningful meant making it come to life in an engaging way through visualizations. Together, they sought to make school learning model data available for every state, but Township also assessed the feasibility of an even more ambitious goal: to visualize every piece of district data over time, in a single place.
Township had taken on similar projects, but not yet at this scale. Rendering 13,800 items on a homepage was a technological feat. With a massive spreadsheet regularly updated by Dr. Oster’s research team, updates were always coming in. With so much information flowing through the site, resizing data files and rendering maps quickly were vital to keeping the site user-friendly with best possible page load time.
Services Provided
Data Visualization
Website Architecture
User Experience Design (UX)
Front End Development
User Interface Design (UI)
Project Team
Engineering Lead: Samuel Yeo
Design + Development: Matt McInerney
Design Contributor: Baxter Estes
Township was able to find data sources that allowed SVG map renderings of every U.S. school district. On top of this, the goal was to have users select dates throughout the early days of the pandemic and compare maps over time. They found a way, but there was one problem: SVG works well for vector graphics like maps, but rendering a complex SVG (with thousands of districts) can cause slow load times. To improve these large-scale SVG map renderings, Township sought a solution.
After a bit of digging, they found it: they offloaded the SVG map rendering to a separate server. This involved converting the SVG maps into static PNG images, which were then transmitted back to the original public-facing site. The change resulted in a significant reduction in load times, dropping from around 10 seconds to 1 second or less.
Insight
Dr. Oster’s books, reports, and studies are based on resources and statistics—and there weren’t enough to create meaningful claims about COVID-19 impacts on education.
Township rose to the occasion, taking large amounts of disparate data from Dr. Oster’s team and overcoming numerous technical challenges to visually present it online; through the project they were able to refine a data visualization skillset that navigates complexity for impact. Since there were zero off-the-shelf options to provide what was required, Township combined best practices to create a final data rendering with a time-based slider interaction at a massive scale.
Both Township and Dr. Oster’s team sought to carve out a path that would help society at large, putting time and effort into a bigger picture, with positive impact—with every step based on plenty of research.
Solution
Dr. Oster came to Township to create a source that “[would] be widely used for any work in which researchers hope to understand the landscape of pandemic schooling.” Township helped bring that data to the public in a digestible way, as a comprehensive, accessible base of data on the intersection of COVID-19, education, and health in schools during the 2020-21 school year.
At the beginning, 20 states had submitted data for the project. Today, 44 of 50 states are represented in the data visualization. Creating a user-friendly site that visually represents the data for two years of education impacts has become an invaluable resource for research and future decisions.
Throughout the partnership, trust was intrinsic—Dr. Oster handed over the data, guided Township in what to build, and allowed Township to further push the bounds of complex data presentation with a user-friendly, informative site.
Read more about the COVID-19 School Data Hub in this press release from Dr. Oster.
“Township has been fantastic to work with; they are responsive and capable problem solvers, and willing to adapt as the project has adapted. I’d recommend them to anyone.”
Dr. Emily Oster, Author and Professor of Economics at Brown University


“Township made our data easy to access AND created interactive visuals for users. The visual features tremendously improved the usability of our site, most notably an interactive U.S. map on our homepage that presents data for U.S. school districts across the country.”
Clare Halloran, Associate Director of the COVID-19 School Data Hub

The Future
The two-year time frame of displayed data will make it possible for researchers to answer crucial questions about pandemic schooling and its far-reaching impacts. Township’s team was equal parts proud and excited to collaborate with Dr. Oster and her team to fill a big data gap beautifully.
Check out some of our writing

Township’s Top 6 Techno-Horror Picks for Halloween
This Halloween, are you looking to be terrified by technology? If so, the Township team has assemble...
Read More

How Phoenix became the most admired web framework among developers.
Stack Overflow found that Phoenix is the most admired web framework and technology. So what about th...
Read More

How to optimize content for humans and robots.
When it comes to optimizing digital content for SEO, who comes first in priority–the humans we hope ...
Read More